Pages
Vlaams Instituut voor de Zee
WoRMS : http://www.marinespecies.org/ (World Reg. Mar. Species)
ERMs : http://www.marbef.org/data/erms.php (Eur. Reg. Mar. Species)
BeRMs : http://www.marinespecies.org/berms/ (Belgian Reg. Mar. Species)
Zooplankton monitoring in the Belgian part of the North Sea is typically sampled within the Lifewatch project by the use of WP2 planktonnets. This is a traditional technique known to give a limited representation of the community as a whole. This limitation can be traced back to several studies indicating that a fraction of the zooplankton community (the most fragile) are being destroyed in the process of captivation. An alternative could be found in the use of a Video Plankton Recorder (VPR), which can observe plankton in their natural orientation without disturbing or damaging fragile species and associations. The VPR can perform in situ sampling where more parameters can be linked to each other (salinity, temperature, depth with abundancies of species).
This study tries to compare the usage of WP2 planktonnets with two different magnification settings and traject courses of the VPR in the Belgian part of the North Sea, with a comparison between these two magnification settings as well. The subject of a distribution pattern of Zooplankton is also briefly studied.
During the monthly Lifewatch campaign of March, a comparison between WP2 plantonnets and the VPR is conducted on the research vessel Simon Stevin. With one magnification setting chosen (S1), the VPR is undulated three times up and down at a chosen station, resulting in a stationary S1 sample. At this station, three WP2 planktonnet samples (WP2-S1) are taken, which are combined into one WP2 sample with a standard deviation. The Simon Stevin then sails trough this chosen point with very long undulations of the VPR with the same magnification setting (S1) resulting in a S1 continuous sample. All these steps are repeated for magnification setting S3.
With the sampling done, WP2 planktonnet samples are stored in a container with 5% formaldehyde and later processed on a ZooSCAN in the Lifewatch lab. This device makes images of the sample brought upon the scanner, which can be determined into different taxa using PlanktonIdentifier. The images obtained by the VPR are manually sorted on a computer, resulting in a dataframe which can be further analyzed in R Studio and Excel.
The abundancies found in WP2-samples are much higher for every species except Phaeocystis, who are only detected with the VPR. This result is expected due to the lower sample volume of the VPR. The detection of Phaeocystis is an example of a fragile species that is not detectable with the WP2 planktonnets.
Secondly detritus is also visible with the VPR, combined with Noctiluca feeding on this matter. This also comes with a downside, because detritus makes up for almost 95% of all the images retrieved by the VPR. This makes the determination of species more difficult. Comparing the two magnification settings, S1 has a much clearer and better result compared to S3. This last setting is too zoomed out, resulting in undetectable particles and further more in low abundancies. When the distribution pattern of Copepoda is studied in stationary and continuous VPR data, no link can be found. In previous studies in other seas/oceans a diel vertical migration (DVM) can be observed, but this is not present in this study. High turbidity of the North Sea combined with low depth measurements and less stratification may be given as explanations why this is not detected. At last a comparison can be made between stationary and continuous samples, resulting in higher abundancies for stationary sampling.
Although WP2 planktonnet samples have much higher abundancies of species found in the Belgian part of the North Sea, the VPR still has an edge on some aspects of research capabilities. It can give a representation of the orientation of species in their normal habitat, with associations between individuals and detritus. It also has the biggest room for improvement. The S1 magnification setting gives the best results in this study and is recommended for further usage. On the matter of sampling, a stationary track gives the best results compared to a continuous sample route. At last no distribution pattern can be detected in this study for Copepoda.
Without zooplankton, life on earth would be completely different. The central location in the ecosystem and the important functions in carbon storage make these organisms extremely important for all life on earth. Changes within the zooplankton population would lead to massive mortality in the ecosystems and would mean an extreme increase of carbon dioxide in the atmosphere. Climate change issues, overfishing and the construction of windmills are putting zooplankton species in danger. Rising ocean temperature and ocean acidification would mean the end of zooplankton.
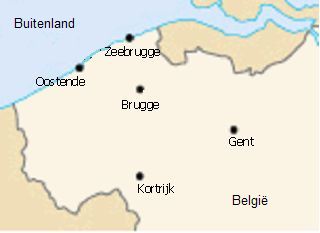
Due to its high sensitivity and extremely important functions, zooplankton is seen as one of the most important indicators of climate change. This is why monthly samples are taken at various locations in the Belgian part of the North Sea by 'het Vlaams Instituut voor de Zee'. These locations are called ‘stations’. One sample is taken at each station to show the population at the sampling location. The extreme variations in densities between stations make it necessary to check whether these variations also occur at a smaller distance from each other. If these variations occur inside a station, the results of the last few years are inaccurate or even wrong, and a sample would be a 'lucky shot’. To check this, five replicates were taken at two different stations.
The samples were analyzed with the ZooSCAN, a revolutionary device to analyze zooplankton samples. Each replicate was analyzed five times in order to be able to identify variations by analyzing them. Using statistical data processing, the variations caused during the analysis can be compared with the variations between the replicates and between the different stations in the same month. In the ideal case, replicates are completely the same and the spread would be similar to the variation caused during the analysis.
The results indicate that the variation between the replicates in the large groups are somewhat higher than the variations observed during analysis. The higher variation has a natural cause and implies that the densities of these species fluctuate somewhat inside a station. For the smaller groups, the results are more encouraging, and the variations are no more significant than those observed during the analyses. This means that the observation of these species is done correctly. When the variations of the replicates are compared with the fluctuations between the different stations, the spread proves to be a lot smaller for the replicates.
It can be concluded that one sampling gives a good indication of the composition of the zooplankton population in the sampling site. Extra samples inside a station or extra analyses with the ZooSCAN can make the results more accurate.
A distribution map is being developed which combines the occurrence records of different databases to study the distribution of marine species and to also see the links between these databases.
The project is envisioned as follows. Using R, all the occurrence records are downloaded from the WoRMS, OBIS, EurOBIS, GBIF and IDIGBIO databases. These are then combined in to a MongoDB database, along with the shapefile of Marine Regions (MR) and Marine Ecoregions Of the World (MEOW). Each shapefile contains a list of polygons, which are linked to the occurrence records via their (latitude/longitude) coordinates. The records also contain a date/time value in most cases. Through an R Shiny app the user can choose the location, taxon and a date range as input. The R Shiny app will query the MongoDB database for the right records and polygons, which will then be plotted on a leaflet map as points and polygons. The infrastructure of this distribution map will be added to the Lifewatch R Shiny projects and to the WoRMS distribution map.
In this traineeship the download is still in progress. The code to download the records is written and is now being applied to download all the records. The MongoDB structure has also been determined.
Further steps of the project, which is the R Shiny app and integration into Lifewatch and WoRMS are still to be done.
|
Tags: biology bioinformatics |
Address
|
Wandelaarkaai 7
8400 Oostende
+32 [0]59/34 21 30 |
Contacts
|
Traineeship supervisor
T'Jampens Roeland
Roeland.TJampens@howest.be |
|
Traineeship supervisor
Bart Vanhoorne
+32 59 34 21 30 bart.vanhoorne@vliz.be |
|
Jonas Mortelmans
jonas.mortelmans@vliz.be |
|
Anouk Ollevier
|